“A model pipeline isn’t just infrastructure — it’s the living process that lets learning continue long after training ends.”

🧭 This article is part of the series:
Part 1 – From Model Development to Scalable, Compliant Operations
Part 2 – Building an MLOps Pipeline Step-by-Step
Part 3 – Designing Adaptive and Resilient MLOps Pipelines
Why Pipelines Matter
Pipelines transform architecture diagrams into living automation.
They handle not only training and deployment but also governance, testing, and feedback.
Modern MLOps pipelines follow a CI/CD/CT mindset: integrate continuously, deliver continuously, and train continuously.
AWS, Databricks, and Google all emphasize that an ML system is never static—each retraining cycle must be traceable, reproducible, and secure.
(AWS MLOps Best Practices, Galileo AI Roadmap)
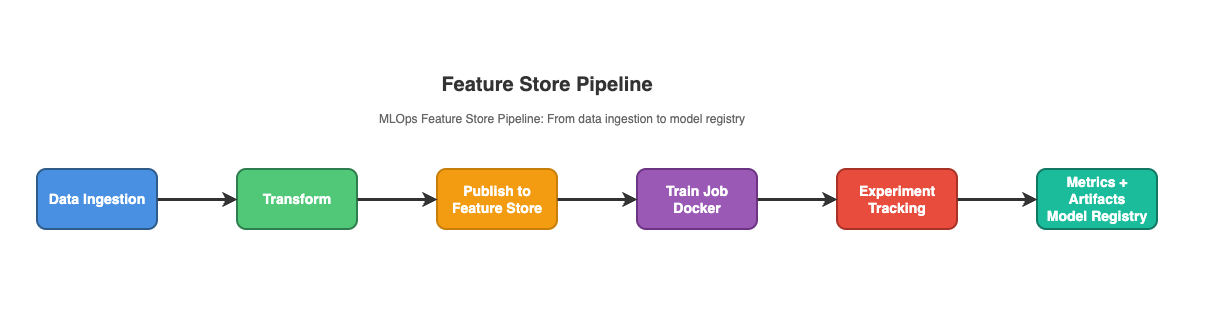
Step 1 — Data Ingestion and Validation
Data ingestion is where chaos meets control—where unstructured streams are cleaned, validated, and cataloged. Before a single model trains, a good pipeline asks: Can I trust this data? Data quality at this stage dictates the reliability of every downstream metric.
Goal
Collect, validate, and version incoming data so every downstream process starts with reliable, traceable input.
Best Practices (AWS + Industry):
- Centralize ingestion via AWS Glue or Amazon Kinesis Data Streams.
- Use data contracts to enforce schema and statistical expectations.
- Validate data with Great Expectations or Deequ to enforce schema and statistical expectations.
- Store curated datasets in S3 versioned buckets with metadata tracked by AWS Glue Data Catalog or DVC, tagging them with source, timestamp, and lineage metadata.
- Log ingestion metrics (volume, latency, anomaly rate) for continuous quality assessment.
“Every bad prediction begins as a bad record. Audit your inputs before you trust your outputs.”
Step 2 — Data Preprocessing and Feature Engineering
Transform clean data into standardized, reusable features for consistent model training and inference.
Once trust is established, the system learns its language of features—the patterns that make data meaningful.
Goal
Transform raw data → feature store ready format.
Core Practices:
- Automate transformations using SageMaker Processing Jobs or Airflow DAGs.
- Centralize reusable features in SageMaker Feature Store or Feast.
- Version feature groups for reproducibility; tag them with data source and timestamp.
- Use Spark or AWS Glue for large-scale ETL.
Feature pipelines act as the muscle memory of your system—consistent, repeatable, and built to scale.
Step 3 — Model Training and Experiment Tracking
Training is where ideas harden into evidence.
A well-designed pipeline turns every experiment into a documented event.
Goal
Train models reproducibly while logging every parameter, artifact, and metric for traceability.
Recommended Practices:
- Containerize training environments using Docker or SageMaker Training Containers.
- Track experiments and log parameters, metrics, and artifacts with MLflow or SageMaker Experiments.
- Use orchestrators such as SageMaker Pipelines or Kubeflow Pipelines for reproducible training.
- Use Amazon SageMaker Debuggers for real-time metric monitoring.
- For distributed training: Leverage AWS Deep Learning AMI or SageMaker Distributed Training.
Step 4 — Model Evaluation and Validation
Evaluation is the conscience of the pipeline: it verifies that what performs well in notebooks behaves responsibly in production.
Goal
Ensure that trained models meet accuracy, fairness, and robustness criteria before deployment.
Best Practices:
- Evaluate accuracy, precision/recall, and latency against baseline metrics.
- Evaluate for bias and explainability using SageMaker Clarify or IBM AIF360.
- Automate testing with Deepchecks or Evidently AI – fail the pipeline if thresholds aren’t met.
- Define “deployment readiness criteria”: performance thresholds + compliance approvals.
- Store evaluation reports and model cards in S3 and link them to the Model Registry entry.
Automated Model Evaluation and Promotion Pipelines
As your MLOps architecture matures, evaluation becomes the most important and the most overlooked stage.
It’s not enough to know a model performs well; you must prove it consistently, across dimensions that matter to both engineers and the business.
Automated evaluation turns this proof into a pipeline. Every new model trains, tests, and justifies itself before reaching production — measured not only by accuracy but also by fairness, latency, cost, and real-world impact.
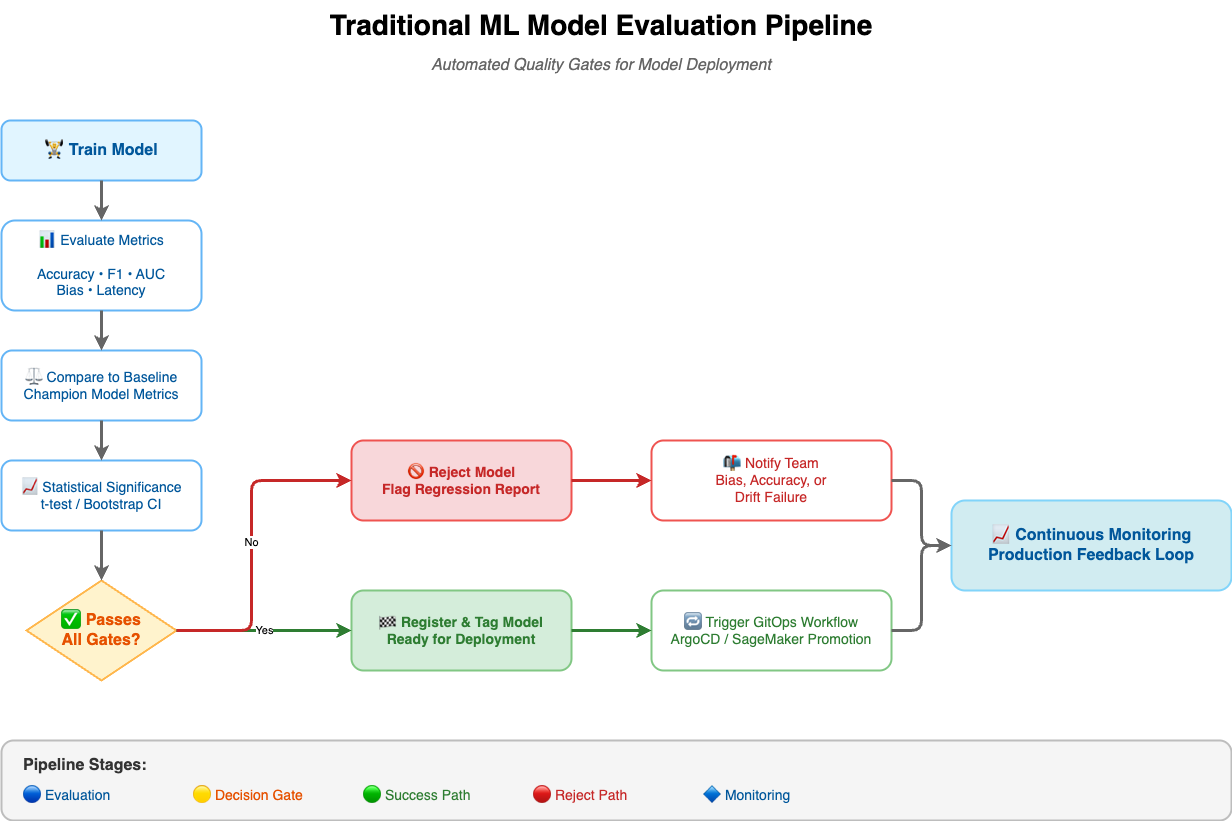
ML Model Evaluation Pipeline
1. From Metrics to Meaning
Traditional evaluation stops at F1 Score or AUC-ROC.
Modern pipelines go further — comparing models statistically, ensuring no regression, and validating business relevance.
| Dimension | Example Metrics | Tools / References |
|---|---|---|
| Performance | Accuracy · F1 Score · AUC-ROC | scikit-learn · MLflow |
| Fairness | Demographic parity · Equal opportunity | Fairlearn · SageMaker Clarify |
| Latency / Cost | p95 response time · cost per prediction | Amazon CloudWatch |
| Explainability | SHAP · LIME | SHAP · LIME |
| Business Impact | Revenue lift % · Engagement rate | Custom instrumentation · Amazon QuickSight |
Each metric becomes a gate in your CI/CD flow — not a chart to review later.
2. Building the Evaluation Pipeline
An automated evaluation pipeline runs whenever a model training job finishes:
Train → Evaluate → Compare to Baseline → Apply Gates → Promote or Reject
- Load Evaluation Sets: Include hold-out, edge-case, and fairness datasets.
- Compute Metrics: Use scikit-learn, Fairlearn, Evidently, or Deepchecks.
- Compare to Champion: Load previous production metrics and test for statistical significance (e.g., t-test p < 0.05).
- Apply Promotion Gates: Only models meeting accuracy, bias, and latency thresholds are registered for deployment.
Example — evaluation orchestration in Python:
passed, failures = evaluator.check_promotion_gates()
if passed:
    mlflow.set_tag("ready_for_deployment", "true")
else:
    mlflow.set_tag("ready_for_deployment", "false")
Promotion decisions are automatic, logged, and reproducible.
3. Beyond Accuracy – Baseline & Significance Testing
Every new model should beat a baseline not by chance, but by evidence.
Use paired t-tests or bootstrapped confidence intervals to confirm improvements.
Integrate these tests directly in your CI pipeline so regressions block merges automatically.
Tracking Business Outcomes, Not Just ML Metrics
from scipy.stats import ttest_ind
p_value = ttest_ind(control, candidate).pvalue
if p_value < 0.05:
    print("✓ Statistically significant improvement")
Statistical rigor is the bridge between experimentation and reliability.
4. Business Metrics Integration
Operational excellence means aligning model quality with business outcomes.
Track metrics such as revenue lift, conversion rate, or user satisfaction alongside precision and recall.
Feed these back into your registry so each model carries a measurable business fingerprint.
“A model isn’t successful when it’s accurate — it’s successful when it moves the needle that matters.”
5. Evaluating LLMs and Generative AI
For LLMs, conventional metrics fail to capture nuance.
Modern evaluation pipelines mix automated frameworks like RAGAS with LLM-as-a-Judge scoring:
Evaluate RAG system using RAGAS framework
from ragas import evaluate
from ragas.metrics import faithfulness, answer_relevancy
results = evaluate(dataset, metrics=[faithfulness, answer_relevancy])
Key dimensions:
- Faithfulness – is the answer grounded in retrieved context?
- Relevance – does it answer the user’s question?
- Safety – is it free from bias or harm?
Use tools like Detoxify or Llama Guard for toxicity checks, and gate promotion on safe-response rates.
Combined with automated cost tracking (tokens per query), this forms a continuous validation loop for GenAI systems.
6. Human-in-the-Loop Evaluation
Automation can’t capture creativity, tone, or domain nuance.
For subjective tasks — summarization, dialogue, clinical text — integrate human-review loops via Labelbox or SageMaker Ground Truth.
Humans validate a sample of automated scores and provide calibration signals, ensuring alignment between machine judgment and human expectation.
7. Continuous Evaluation in Production
Evaluation shouldn’t end at deployment.
Use shadow deployments or A/B tests (AWS A/B Testing Guide) to compare candidate and champion models in live traffic.
Capture drift, user behavior, and feedback — then feed these back into retraining pipelines.
The result is a living feedback loop:
train → evaluate → deploy → monitor → retrain, each cycle smarter than the last.
“Evaluation is the conscience of MLOps — it keeps automation accountable and learning honest.”
Step 5 — Model Deployment and Serving
Deployment is where research meets reality.
Here, the focus shifts from performance to stability and safety.
Goal
Deliver validated models to production through repeatable, reversible deployments.
Package approved models → deploy to inference endpoints or batch jobs.
Deployment Patterns:
- Real-Time: Deploy real-time models on SageMaker Endpoints, FastAPI containers on EKS or Fargate.
- Batch: Handle batch inference with SageMaker Batch Transform.
- Streaming: AWS Kinesis or Kafka connectors.
Automation Tools:
- Argo CD for GitOps-based deployments.
- AWS CodePipeline for approval gates.
- Canary and blue/green rollouts via Argo Rollouts or SageMaker Endpoint variants.
“Treat every model like a microservice. Version it, monitor it, and never deploy blind.”
Step 6 — Monitoring and Continuous Feedback
After deployment, models start to age.
Monitoring is how you keep them honest.
Goal
Detect data drift and model decay; trigger retraining when necessary.
Best Practices:
- Monitor and track input/output prediction distributions using SageMaker Model Monitor.
- Use EventBridge + Lambda to trigger retraining pipelines when drift thresholds are breached.
- Visualize latency, throughput and drift metrics in Amazon CloudWatch or Grafana.
- Store metrics as time-series data for long-term analysis (e.g., AWS Timestream).
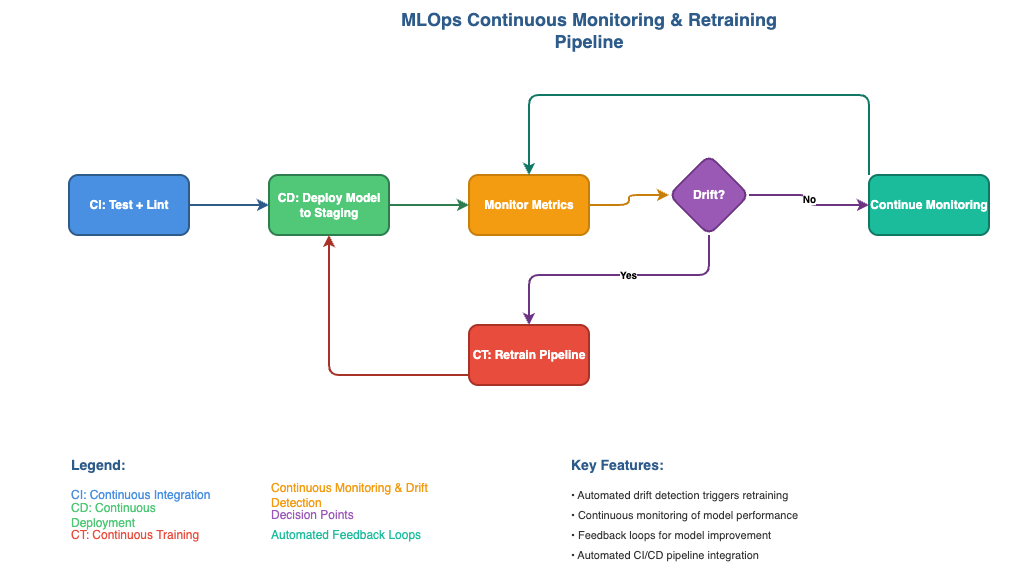
Embedding CI/CD/CT Principles in MLOps
CI/CD/CT is the rhythm section of the MLOps orchestra—keeping every instrument in time. Establish continuous integration, delivery, and training cycles that keep models synchronized with code and data changes.
| Cycle | Purpose | Example Practices |
|---|---|---|
| CI (Continuous Integration) | Validate new code/data | Automated linting, schema tests, and dataset diffs using GitHub Actions + CodeBuild |
| CD (Continuous Delivery) | Automate deployment promotion | GitOps via Argo CD or approval gates in CodePipeline |
| CT (Continuous Training) | Retrain when data drifts | Event-driven SageMaker Pipelines or Argo Workflows triggered by drift alerts |
Together, they turn static workflows into living feedback loops—pipelines that learn, deploy, and adapt without manual intervention.
Putting It All Together — Kubernetes + Argo CD (GitOps) Pipeline Example
Objective: Use a cloud-agnostic, Kubernetes-native toolchain to operationalize CI/CD/CT with strong separation of concerns and auditable change history.
Picture your pipeline as code, versioned and observable: data validation jobs run as Argo Workflows, images build in CI, and deployments sync automatically through Argo CD. KServe or FastAPI hosts inference services, while Prometheus and Evidently feed live metrics into dashboards. When drift alerts fire, Argo Workflows retrains and re-registers the next candidate.
This ecosystem behaves like a self-tuning instrument—adjusting its pitch whenever the data changes.
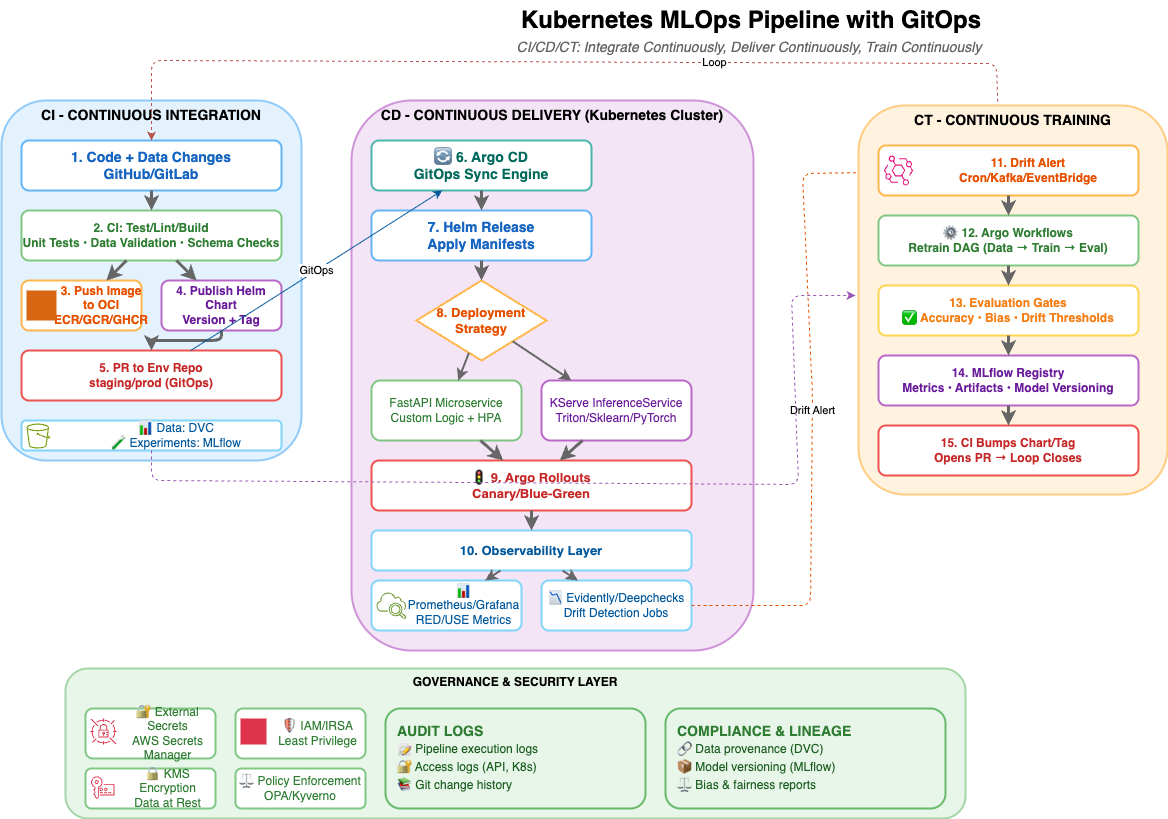
Kubernetes MLOps Pipeline with GitOps
The diagram above illustrates the complete CI/CD/CT loop with three distinct but integrated phases:
- CI (Blue): Continuous Integration with testing, building, and GitOps PR creation
- CD (Purple): Continuous Delivery through Kubernetes with GitOps sync and progressive rollouts
- CT (Orange): Continuous Training triggered by drift detection, completing the feedback loop
Stack at a Glance
- Source Control & CI: GitHub / GitLab + Actions/Runners for build, test, image push
- Image Registry: ECR/GCR/GHCR/ACR (any OCI registry)
- Data & Artifacts: DVC for data versioning, MinIO/S3 for blob storage, MLflow for experiments/registry
- Orchestration: Argo Workflows or Kubeflow Pipelines for train/eval DAGs
- Deploy (GitOps): Argo CD + Helm/Kustomize
- Serving: FastAPI microservice or KServe for model servers (Triton/Sklearn/PyTorch)
- Autoscaling: HPA + KEDA for QPS/queue-driven scale
- Monitoring: Prometheus + Grafana, plus model drift via Evidently / Deepchecks
- Secrets: External Secrets Operator wired to cloud secrets managers
- Progressive Delivery: Argo Rollouts for canary/blue-green
- Eventing (CT): Cron or Kafka/NATS → Argo Workflows trigger retraining
End-to-End Flow
Imagine the workflow as a chain of orchestration that connects each automation stage:
- Commit & Build (CI):
- A new dataset or training script is committed to GitHub – Dev pushes code + pipeline definitions.
- A CI job (GitHub Actions or CodeBuild) kicks off unit tests, data validation, and Docker image builds for the training environment * CI runs unit/data checks, builds Docker image, pushes to OCI registry, publishes a Helm chart with the new app/model image tag.
- Artifacts/metrics logged to MLflow; datasets tracked with DVC.
- Continuous Training (CT):
- Once validated, an Argo Workflow launches inside the Kubernetes cluster — orchestrating data preprocessing, model training, and evaluation. * Argo Workflows (or Kubeflow Pipelines) retrain DAG is triggered on schedule (Cron) or event (e.g., drift alert, new data). * New model → logged in MLflow Model Registry → CI opens a PR to bump the serving chart → Argo CD rolls out the new version.
- Metrics and artifacts are logged in MLflow or SageMaker Experiments, and the approved model is versioned in the Model Registry.
- GitOps Promotion (CD):
- When a model passes thresholds, the workflow opens a pull request to update the inference manifest in a Git repository — usually something like
models/production.yaml. * CI raises a pull request to the environment repo (e.g.,env/staging) bumping the Helm chart/tag. - This PR isn’t a deployment yet; it’s an auditable event. Human reviewers or automated policy checks decide whether to merge.
- After review/approval, merge updates the desired state. Argo CD detects drift and syncs the cluster to that commit.
- When a model passes thresholds, the workflow opens a pull request to update the inference manifest in a Git repository — usually something like
- Deploy & Traffic Shaping (CD):
- Once merged, Argo CD detects the change and applies it to the target environment.
- Kubernetes spins up or updates the inference service — typically using KServe or FastAPI inside a Fargate pod — pulling the latest model artifact from S3 or the registry.
- Helm installs/updates either: * a FastAPI model microservice (custom logic), or * a KServe InferenceService (standardized servers + optional dynamic batching).
- Argo Rollouts performs a canary (e.g., 10% → 25% → 50% → 100%) with automated analysis (latency/error SLOs).
- Rollbacks are trivial: revert the Git commit, and Argo CD reconciles back automatically.
- Monitoring + Feedback:
- Real-time metrics stream to Prometheus and Grafana, while Evidently AI or SageMaker Model Monitor compare live predictions with baseline data. * Prometheus/Grafana track RED/USE metrics; app logs via Loki/Fluent Bit.
- Evidently/Deepchecks jobs compare live vs. training distributions; results posted to a dashboard and stored with run metadata. * When drift crosses thresholds, an EventBridge trigger or Kubernetes CronJob launches retraining — restarting the loop.
This isn’t a static pipeline; it’s a self-healing ecosystem.
Every change — from data schema updates to model versions — travels through the same transparent Git workflow, leaving behind an auditable trail of decisions.
🧭 Conclusion — From Architecture to Automation
The architecture from Part 1 now moves under its own power.
Data flows, models evolve, and feedback keeps the system accountable.
Each stage—ingestion, training, deployment, monitoring—forms one beat in the rhythm of continuous learning.
In Part 3, we’ll explore how to make these pipelines resilient—designing for flexibility, governance, and the ability to adapt when the world changes faster than your code.
“A model pipeline isn’t just a way to train and deploy models — it’s how learning becomes reliable, and reliability becomes trust.”

Leave a comment