Everything Is Breaking All At Once
A personal assessment of interacting technology, economic, and geopolitical risks, with conditional pathways and defined fiscal scenarios.
What this post covers
- The Setup: Seven Disruptions, One Moment
- 1. Something Big Is Happening (And Most People Are Asleep)
- 2. The CEOs Are No Longer Hedging
- 3. RAMageddon: The Infrastructure of AI Is Already Breaking
- 4. The US-China AI War Is Already Happening
- 5. Fiscal Pressure: Keep the Assumptions Consistent
- 6. Taiwan: A Concentration of Advanced Chip Manufacturing
- 7. The World Order: Not a Metaphor Anymore
- The Compound Effect: Why This Moment Is Different
- Is This Like 2008? Is It Like the Great Depression?
- What Could Actually Counter the Doom Scenarios
A data-driven look at the seven disruptions converging in 2026 — and what they mean for all of us
I’m not a pessimist by nature. I believe in technology. I believe in human adaptability. But I’ve been watching this strange pile-up of crises form over the past year, and I can’t shake the feeling that we’re in the “this seems overblown” phase of something that isn’t overblown at all.
So I dug in. I pulled the primary sources — the government data, the academic papers, the conference proceedings, the earnings reports. I wanted to separate the doom content from the doom reality. What I found wasn’t reassuring.
Here’s what’s actually happening.
The Setup: Seven Disruptions, One Moment
In the past 12 months, seven distinct crises have been unfolding simultaneously. Each one, in isolation, is a serious but manageable disruption. Together, they form something that has no historical precedent — because never before have all of these fault lines stressed at once.
- The AI labor disruption — machines replacing cognitive work at scale
- The Anthropic confirmation — the company that built the AI saying the damage is real
- RAMageddon — the physical infrastructure underpinning AI is hitting a wall
- The US-China AI war — the two superpowers locked in a technology arms race
- U.S. fiscal pressure — projections and scenarios depend on growth, effective interest costs, and the primary balance.
- Taiwan: a geographic concentration of advanced semiconductor manufacturing and a potential source of supply disruption.
- The world order collapsing — not a metaphor; this is what world leaders literally said at Munich in February 2026
Let me take them one by one, then show you how they connect.
1. Something Big Is Happening (And Most People Are Asleep)
In February 2026, Matt Shumer — CEO of OthersideAI and someone who has spent six years building AI products — published an essay that got 80 million views on X before most people had seen it. It’s called “Something Big Is Happening”.
His comparison: February 2020. COVID was spreading. People were saying it was overblown. Then everything shut down.
Shumer’s message: we’re at that moment again.
Here’s what makes him credible — he’s not predicting the future, he’s reporting his present:
“I describe what I want built, in plain English, and it just… appears. Not a rough draft I need to fix. The finished thing.”
He runs a software company. He doesn’t write code anymore. He describes what he wants, and AI builds it.
The METR benchmark organization actually measures this. They track the length of real-world tasks that an AI model can complete autonomously without human help:
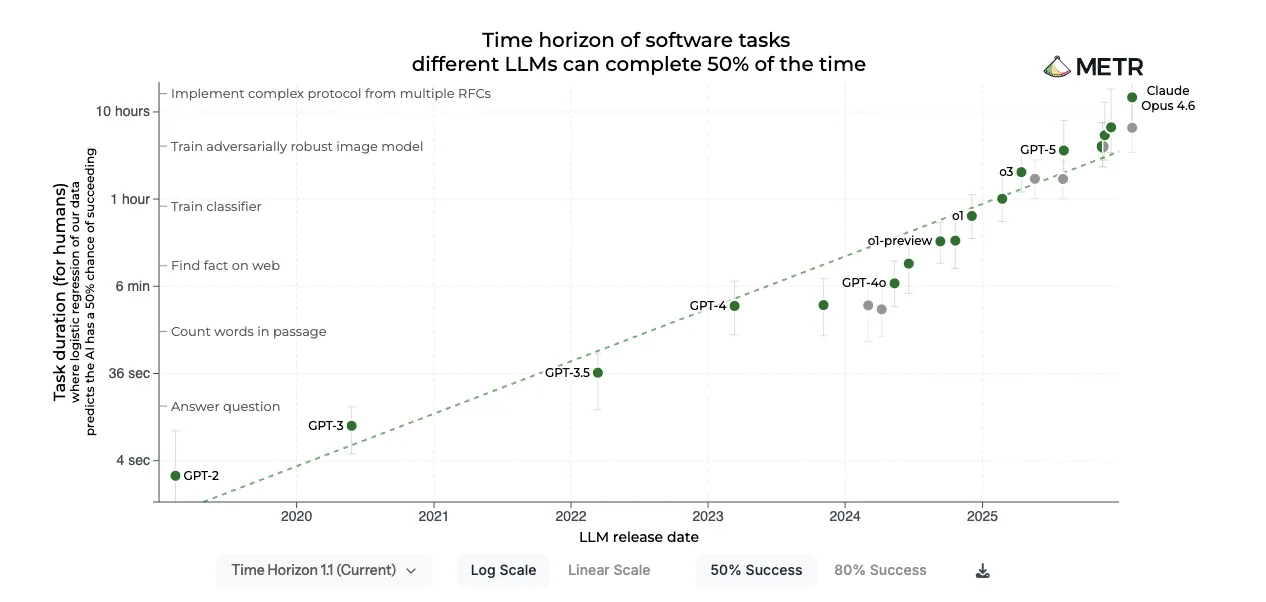
Analysis code is available on GitHub. Raw data available here
| Time period | Maximum autonomous task length |
|---|---|
| ~1 year ago | ~10 minutes |
| Mid-2025 | ~1 hour |
| Late 2025 | Several hours |
| Early 2026 | ~10 hours of complex human expert work |
This isn’t a chatbot that helps you write emails. This is autonomous task completion at professional-level quality. And the curve is exponential.
What I think: I use these models every day — building software, shipping production applications, what people call “vibe coding.” So I’m not speculating about what’s coming. I’m describing what’s already here.
What changed with the current frontier models isn’t just speed or quality — it’s the nature of the interaction. I describe what I want built and the system doesn’t just write code, it applies best practices, catches its own mistakes, verifies the output end-to-end, and iterates until the thing actually works. Not a rough draft I clean up. A working system I deploy. The gap between “person who can code” and “person who cannot” has effectively collapsed for a wide class of software problems.
That’s not an incremental improvement to autocomplete. That’s the removal of a skill barrier that took years to build. And software development is one of the highest-paid, most defensible professions in the modern economy. If it’s happening there first, it isn’t stopping there.
Source: Fortune — “Something Big Is Happening” (Feb 11, 2026) | Fortune rebuttal (Feb 20, 2026)
2. The CEOs Are No Longer Hedging
Dario Amodei is the CEO of Anthropic — the company that built Claude, including the Claude Opus 4.6 model many consider the most capable AI yet released. He is, by almost universal consensus, the most safety-conscious major AI CEO. He doesn’t hype. He’s the one who applies brakes.
He stopped applying brakes on this one.
In 2025, Amodei told CNN and Axios directly: AI could wipe out 50% of all entry-level white-collar jobs and spike unemployment to 10–20% within one to five years. He said AI companies and government need to stop sugar-coating this. The affected sectors: technology, finance, law, consulting — the entire professional class.
Then in February 2026, Microsoft AI CEO Mustafa Suleyman went further. He predicted that virtually all white-collar tasks will be fully automated within 12–18 months — for lawyers, accountants, project managers, marketing professionals. Not years. Months.
Both of these men run companies deploying this technology at scale. They are not researchers speculating about the future. They are watching the capability curves from the inside.
The January 2026 data from Anthropic’s own Economic Index (based on 2 million real Claude conversations) shows what this looks like in practice:
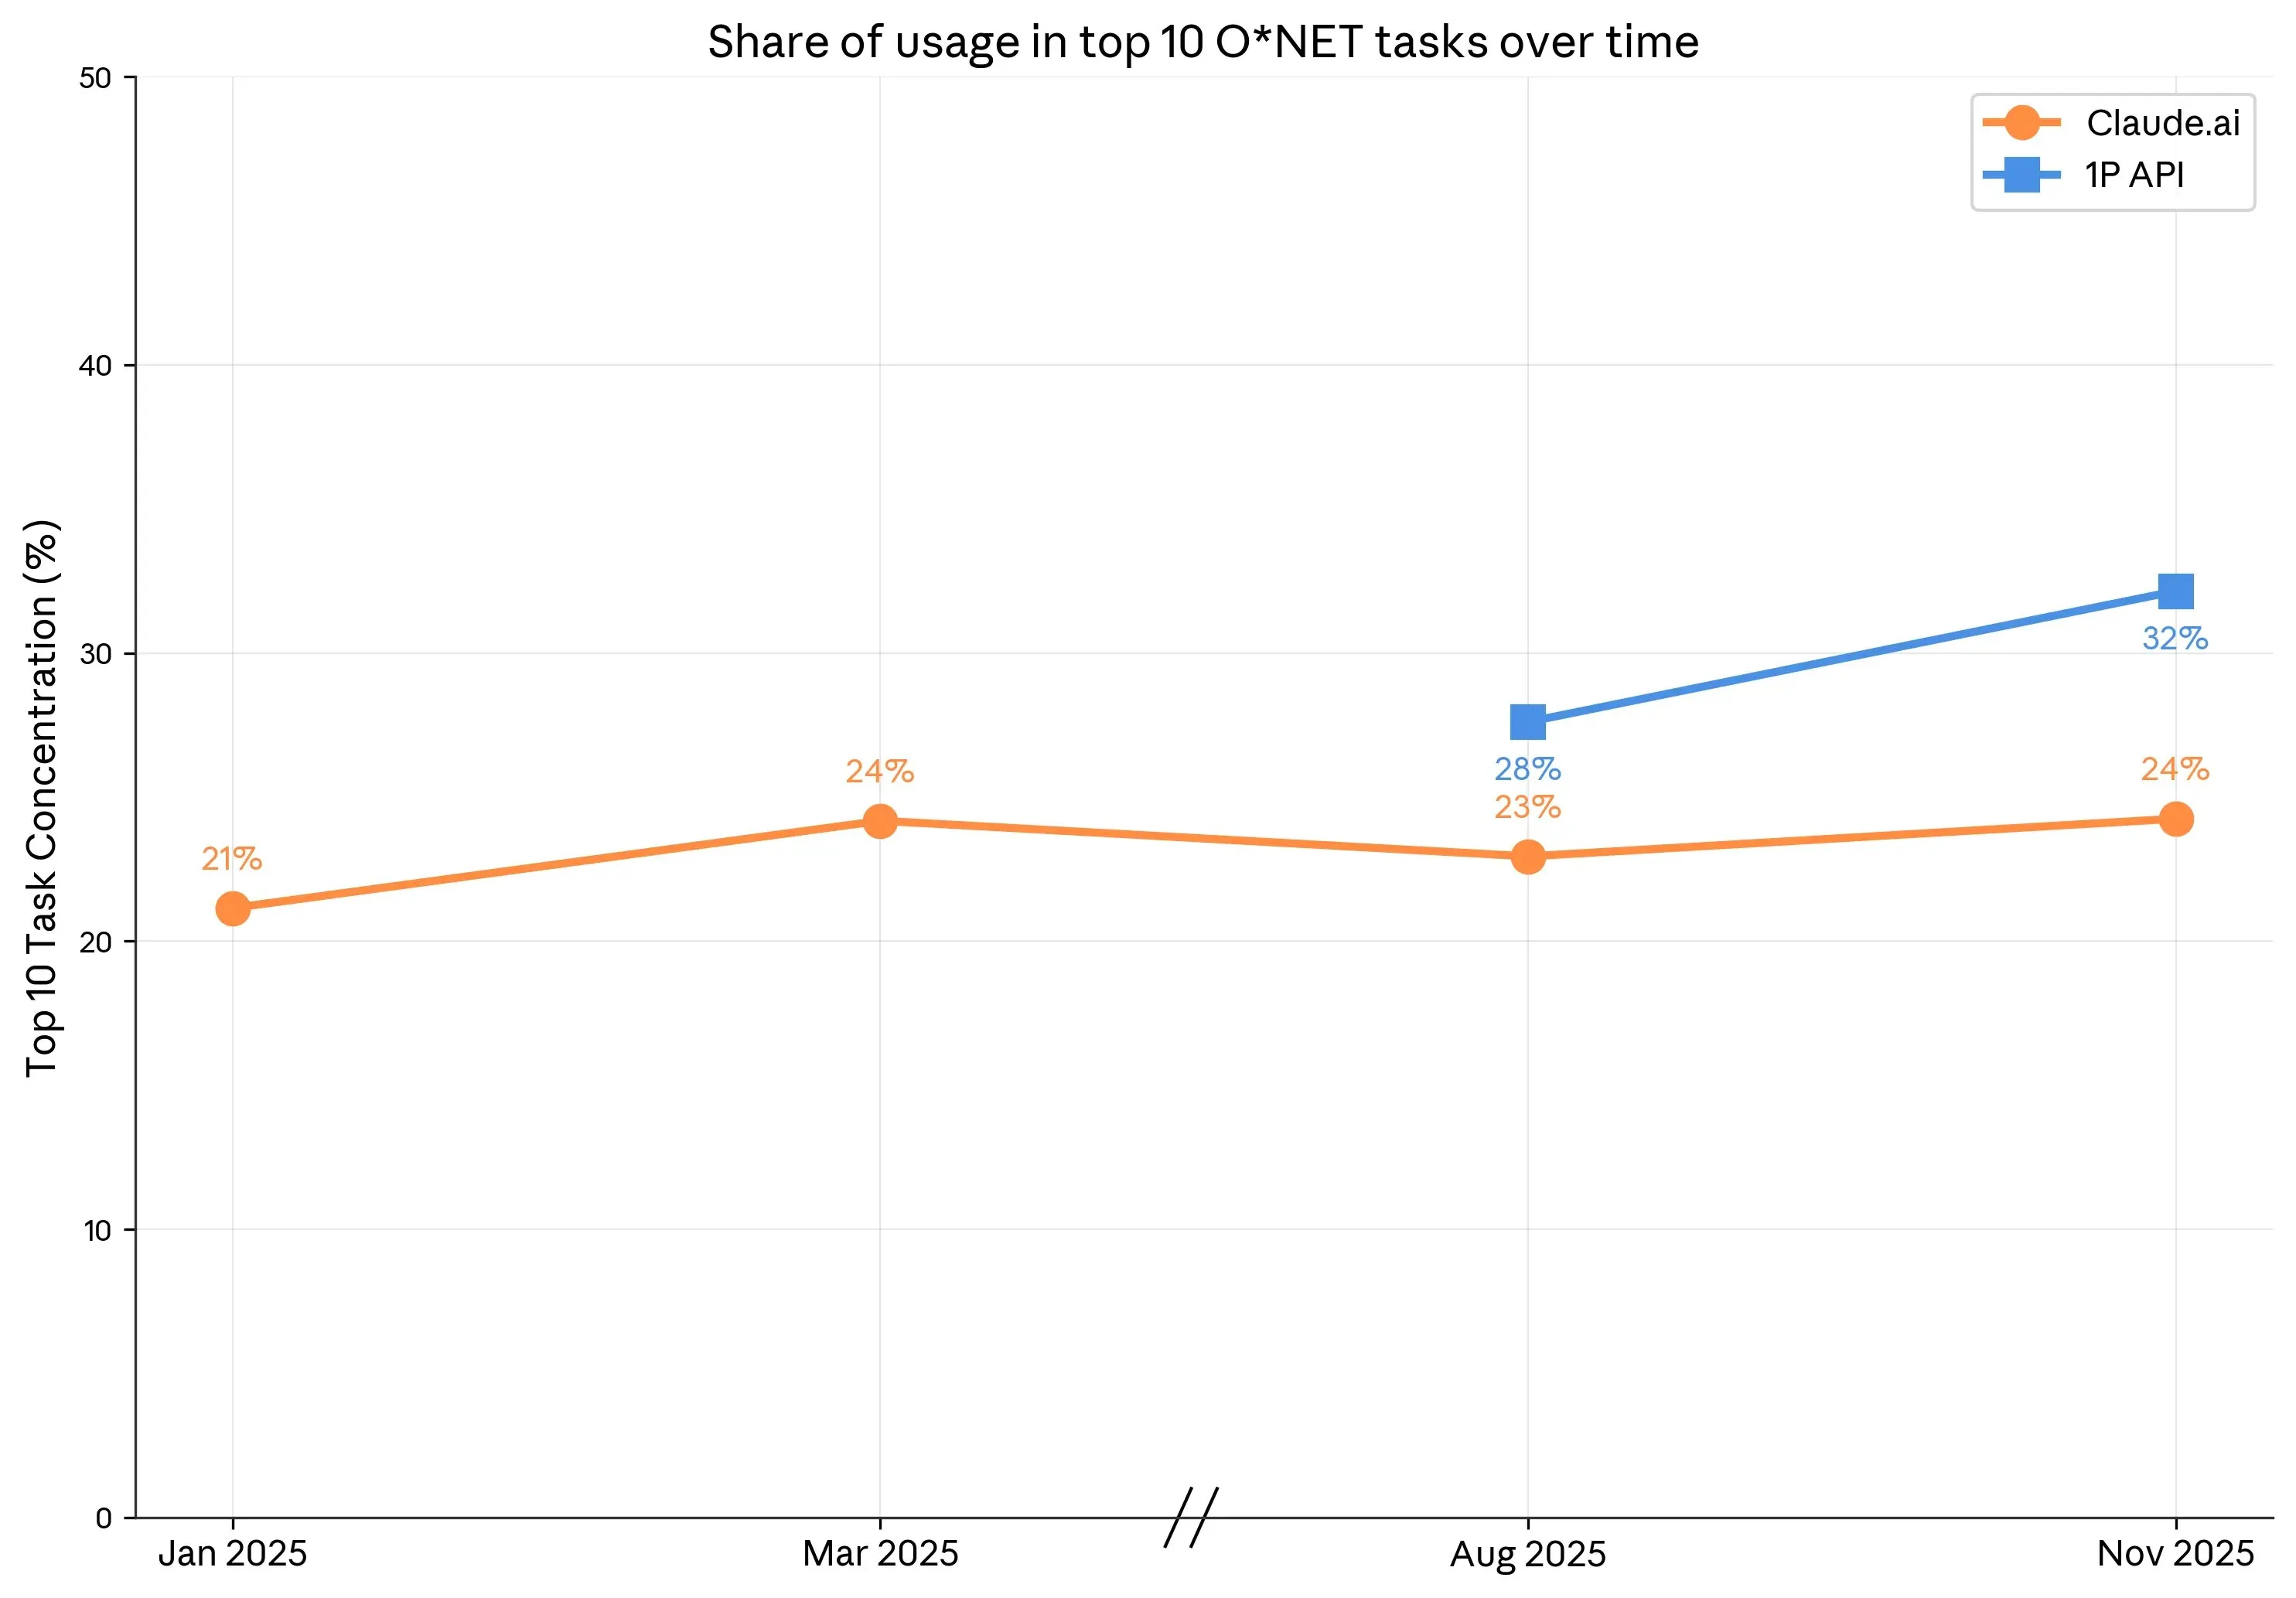
Source: Anthropic Economic Index — January 2026 Report
| Finding | Data |
|---|---|
| Jobs where AI can handle ≥25% of tasks | 49% (up from 36% in early 2025) |
| Tasks sped up for high school–educated workers | 9× faster |
| Tasks sped up for college-educated workers | 12× faster |
| Average education level of tasks Claude automates | 14.4 years (associate’s degree level — above the economy-wide average of 13.2 years) |
The task mix in Claude usage data makes me question the assumption that a degree alone protects a job. But conversations with one provider are a selected sample of use, not a representative measurement of all jobs or proof that those tasks have been automated in workplaces.
The products are already here for non-coders. In January 2026, Anthropic launched Claude Cowork — a file management and browser-control agent for people who never wrote a line of code. It doesn’t just suggest what to do. It does it: accessing files, controlling browsers through a Chrome extension, manipulating applications, executing tasks autonomously.
OpenClaw is an example of growing interest in tool-using agents. In his February 2026 announcement, creator Peter Steinberger said he was joining OpenAI and that OpenClaw would remain open and independent under a foundation. That is not the acquisition of the project described in the earlier version. Availability of an agent also does not establish a user count or measured labor displacement.
The Stanford Digital Economy Lab reported relative employment declines among early-career workers in AI-exposed occupations using ADP payroll data. That is an observed employment pattern within the study’s sample and design. It is different from announced layoffs, exposure scores, or an executive’s forecast, and it does not establish that every decline was caused by AI.
The aggregate labor statistics look fine. But that’s the K-shaped economy in formation — the top arm goes up (capital owners, AI-augmented professionals, investors), while the bottom arm quietly descends (entry-level workers, mid-skill roles, career ladder access). GDP can look healthy while the bottom half of the labor market is already falling. The macro stats stayed clean in 2007 right up until they didn’t.
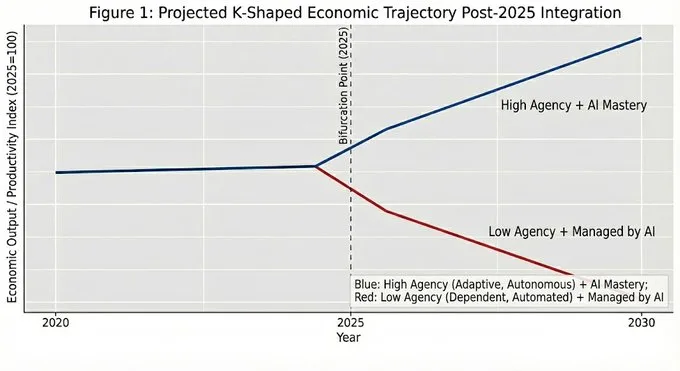
What I think: The thing that changed in the past 90 days isn’t the theory — it’s the products. Cowork, OpenClaw, Claude Code, ChatGPT Codex — these are autonomous agents in the hands of regular people right now, doing work that was previously human-only. The runway between “impressive demo” and “deployed at scale” has collapsed to weeks.
Source: Anthropic Economic Index — January 2026 Report (primary) | Fortune — Claude Code and Cowork for non-coders (Jan 2026) | Fortune — Microsoft AI CEO: 12–18 months to automate all white-collar work (Feb 2026) | | Axios — White-collar bloodbath
3. RAMageddon: The Infrastructure of AI Is Already Breaking
Here’s the thing about AI eating the world: it’s a physical process. It requires electricity, buildings, fiber, and above all — memory chips.
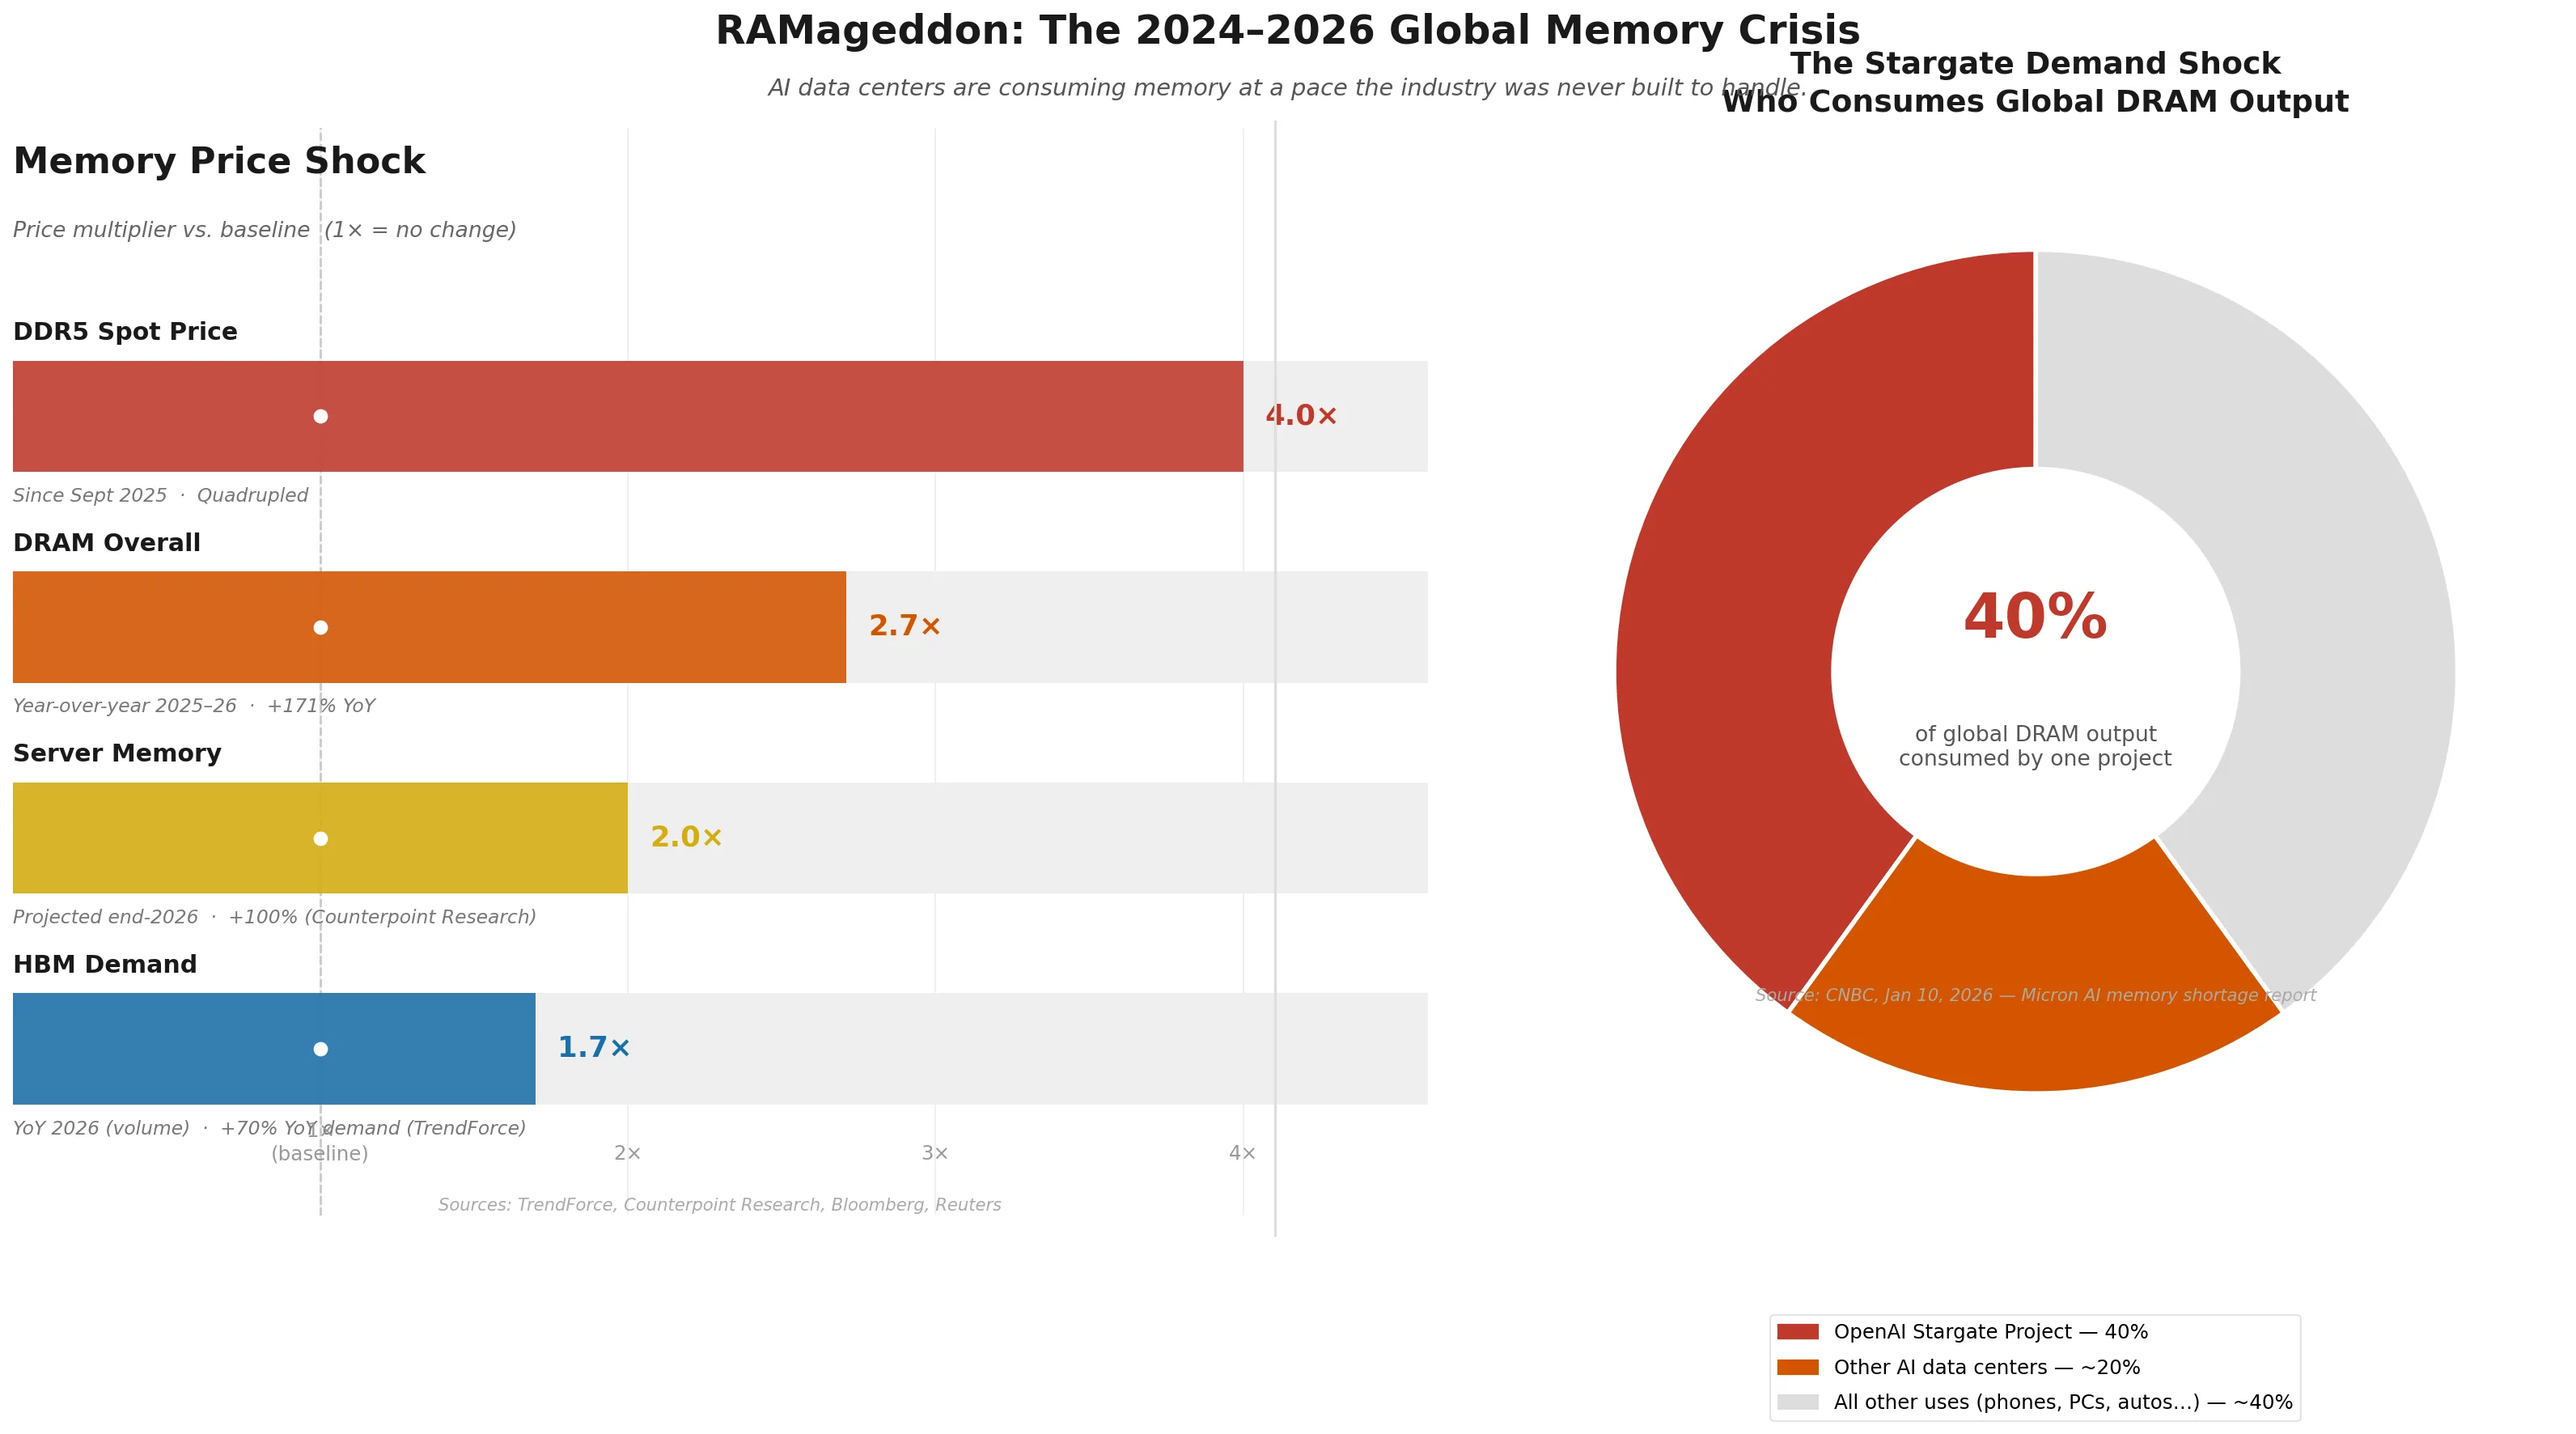
The 2024–present global memory shortage — known as RAMageddon — is real, documented, and measurable. And the numbers are extraordinary:
| Metric | Data |
|---|---|
| DRAM price increase (year-over-year) | +171% |
| DDR5 spot price change since Sept 2025 | Quadrupled |
| HBM demand growth (2026) | +70% YoY (TrendForce) |
| Server memory price projection | Doubles by end-2026 (Counterpoint Research/Reuters) |
This is not a chip shortage caused by COVID. This is different. The three companies that produce high-bandwidth memory (HBM) — Samsung, SK Hynix, and Micron — are reallocating production away from consumer DRAM (used in your phone, your laptop, your car) toward AI server memory. Why? Because the margins are dramatically higher.
One gigabyte of HBM consumes 3× the wafer capacity of standard DDR5 DRAM. And OpenAI’s Stargate Project alone — a $500B AI infrastructure initiative — is reported to require enough memory to consume up to 40% of global DRAM output.
The consequences are already visible:
- Elon Musk and Tim Cook have both publicly flagged production constraints from DRAM shortages
- Apple’s iPhone margins are being compressed (memory now ~30% of low-end phone bill of materials, up from 10%)
- Sony is reportedly considering pushing the next PlayStation to 2028 or 2029
- IDC warns the shortage effects could persist well into 2027 and beyond
What I think: The AI buildout is constrained by physical reality — and that constraint is already rippling through the economy. This is not just a tech industry problem. Memory chips are inputs to automotive, medical devices, consumer electronics, industrial systems. The cascade is underway.
Source: IEEE Spectrum — AI Boom Fuels DRAM Shortage | Wikipedia — 2024-present global memory supply shortage | Bloomberg — AI Boom Driving Global Memory Chip Shortage (Feb 2026)
4. The US-China AI War Is Already Happening
Ray Dalio identifies five types of war between great powers: trade wars, technology wars, capital wars, geopolitical wars, and military wars. The U.S. and China are currently fighting four of five simultaneously.
The technology war is the most consequential front. Since 2018, the U.S. has been systematically restricting China’s access to advanced semiconductor chips and the equipment needed to manufacture them. The Biden administration expanded these controls dramatically in 2022–2023. The Trump administration extended them to foreign affiliates in September 2025.
China retaliated ten days later with licensing requirements on rare-earth exports — the materials essential for EV motors, wind turbines, and defense systems. China controls ~85% of global rare earth processing. This is their counter-weapon.
Where China actually stands on chips:
The Council on Foreign Relations is unambiguous: Huawei cannot compete with Nvidia on raw compute. China’s AI chips are significantly less powerful and the gap is widening on that specific dimension. China’s own EUV lithography prototype won’t reach commercial viability until 2030 at the earliest.
But the chip war is only one of the wars China is fighting — and it’s not the one China is winning.
The robotics leap nobody was ready for:

On February 17, 2026, at China’s most-watched annual broadcast — the Spring Festival Gala, with an audience in the hundreds of millions — the headlining performers were not humans. They were robots.
Two dozen Unitree humanoid robots performed the world’s first continuous freestyle table-vaulting parkour, aerial flips, continuous single-leg flips, wall-assisted backflips, and a 7.5-rotation grand spin — in close choreography with human child performers, wielding swords and nunchucks. One year earlier at the same gala, Chinese robots wobbled through a simple handkerchief dance. The one-year leap was that stark.
The market data behind the spectacle: China accounted for 90% of the roughly 13,000 humanoid robots shipped globally last year. Morgan Stanley projects China’s humanoid sales will more than double to 28,000 units in 2026. This is not a demo. China is in volume production on humanoid robots while the U.S. is still in prototype phase.
The U.S. strategy assumed that denying China chips would deny China AI capability. It did not account for China building physical AI — robots — on a different performance curve entirely.
The pharmaceutical front — where China has already overtaken the US:
The chip war gets the headlines. The drug war doesn’t. It should.
China has surpassed the U.S. in total clinical trial volume — conducting approximately 7,700 trials in 2025 vs. ~6,200 in the U.S. — and has widened that lead every year since 2021. China’s share of global biotech out-licensing deals hit a record $135.7 billion last year, more than double 2024’s total of $51.9 billion. AstraZeneca, Pfizer and Sanofi have all signed multibillion-dollar deals paying Chinese AI drug companies for access to their discovery engines.
The innovation pipeline shift is the starkest indicator:
- China’s share of global drug innovation pipeline assets: ~30% in 2025 — up from just 10% in 2019
- In Antibody-Drug Conjugates (ADCs), bispecifics, and AI-designed small molecules, the innovation gap has reversed — China now leads in early-stage development across several therapeutic areas
- China could become one of the first countries to approve a drug fully designed by artificial intelligence in 2026
Then there’s PANDA. Alibaba’s DAMO Academy built a deep-learning model called PANDA specifically for pancreatic cancer — historically one of the deadliest cancers precisely because it’s almost always caught too late. The numbers are extraordinary:
- 92.9% sensitivity in detecting pancreatic ductal adenocarcinoma
- 99.9% specificity — an extraordinarily low false-positive rate
- Outperforms radiologists by 34.1% on sensitivity
- Since clinical rollout in late 2024, PANDA has scanned 180,000+ CT scans and identified ~24 cancer cases — 14 caught at an early, treatable stage that human radiologists had missed
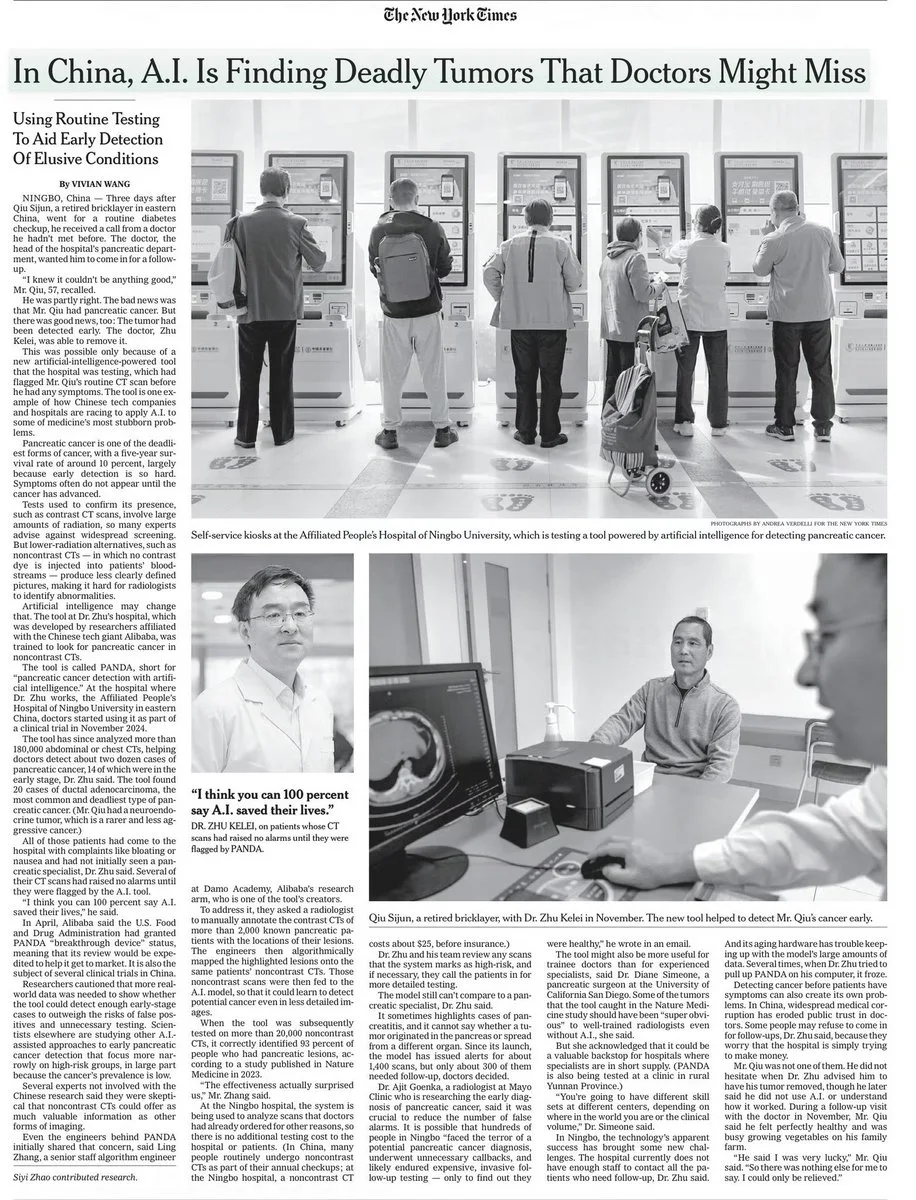
The key innovation: opportunistic screening. PANDA scans routine CT images taken for completely unrelated reasons — kidney stones, trauma, a check-up — and finds hidden pancreatic tumors the human eye would have missed entirely. The patient comes in for one thing and leaves knowing they have cancer early enough to treat it.
A reported FDA Breakthrough Device designation for PANDA would be a development and review milestone, not authorization to market the device or confirmation of clinical effectiveness. The FDA explains that distinction. The earlier inference that designation proved the system’s clinical superiority is removed.
This is the part of the US-China competition that doesn’t fit the “chips and missiles” narrative. China is not just trying to copy Western technology. In robotics, pharmaceuticals, and medical AI, it is now producing original innovation that the rest of the world is racing to adopt.
AI standards — the quietest battlefield:
The East Asia Forum (Feb 2026) identifies standards diplomacy as China’s next strategic move: making Huawei’s AI software the global default the way it made Huawei 5G the default across the developing world. Whoever sets the standards shapes the ecosystem for decades — often independent of who has the best hardware.
What I think: The U.S. export control strategy won the chip battle and may be losing the war. China responded to chip restrictions not by giving up, but by redirecting into efficiency (DeepSeek showed that), physical AI (robotics), biological AI (pharma), and standards diplomacy. The assumption that restricting access to one input controls the whole competition has already been falsified. China is not one disruption away from falling behind — it is multiple disruptions ahead in fields the U.S. isn’t even watching closely.
Source: CNBC — China humanoid robots, one-year leap (Feb 20, 2026) | Al Jazeera — Robots at Spring Festival Gala (Feb 17, 2026) | NYT — China’s AI finds pancreatic cancer before doctors can (Jan 2, 2026) | Hyperight — PANDA AI cancer detection | DrugPatentWatch — China leads AI drug discovery (2026) | SCMP — China to approve first AI-designed drug (2026) | CFR — China’s AI Chip Deficit | East Asia Forum — Standards war (Feb 2026)
5. Fiscal Pressure: Keep the Assumptions Consistent
This is the part that makes me worry about our ability to respond to other shocks. Rising debt service can constrain choices, but a debt ratio is not a default forecast.
The previous table combined spending and revenue for one year with interest from another. It also used a current ten-year Treasury yield as though it were the effective interest rate on the existing debt stock. Those inputs cannot support the calculation presented, so that table and its inferred primary deficit have been removed.
For a simplified domestic-currency scenario, ignoring valuation and other stock-flow adjustments:
b_t = ((1 + r_t) / (1 + g_t)) * b_(t-1) + d_tHere b is debt divided by GDP, r is the nominal effective interest rate on the opening debt stock, g is nominal GDP growth, and d is the primary deficit divided by current-period GDP, positive for a deficit. Rates and balances must cover the same period. More complete models also account for other debt-creating flows. See the IMF’s debt-projection methodology.
Illustrative arithmetic, not a U.S. forecast: with opening debt at 100% of GDP, r = 3%, g = 4%, and a primary deficit of 2% of GDP, the next ratio is 1.03 / 1.04 × 100 + 2 = 101.04%. Debt rises even though growth exceeds the interest rate. At those assumptions, a primary deficit of about 0.96% of GDP would stabilize the ratio before other adjustments.
My concern is that sustained deficits and higher debt service can make responding to shocks more difficult. How severe that constraint becomes depends on policy, growth, financing conditions, and the type of shock. The arithmetic alone does not show that a fiscal crisis is inevitable or that the government has no remaining response capacity.
6. Taiwan: A Concentration of Advanced Chip Manufacturing
Taiwan’s main island is approximately 394 km long and 144 km at its widest, according to the Executive Yuan. The concern here is the geographic concentration of advanced chip manufacturing, not the incorrect island-size comparison or the earlier claim that every chip from several named companies is fabricated there.
The island is 160 kilometers off the coast of mainland China.
In May 2025, Taiwan’s defense ministry reported Chinese warplanes entering Taiwan’s air defense zone more than 200 times per month — up from fewer than 10 times per month five years prior. This is not a political statement. It is documented escalation.
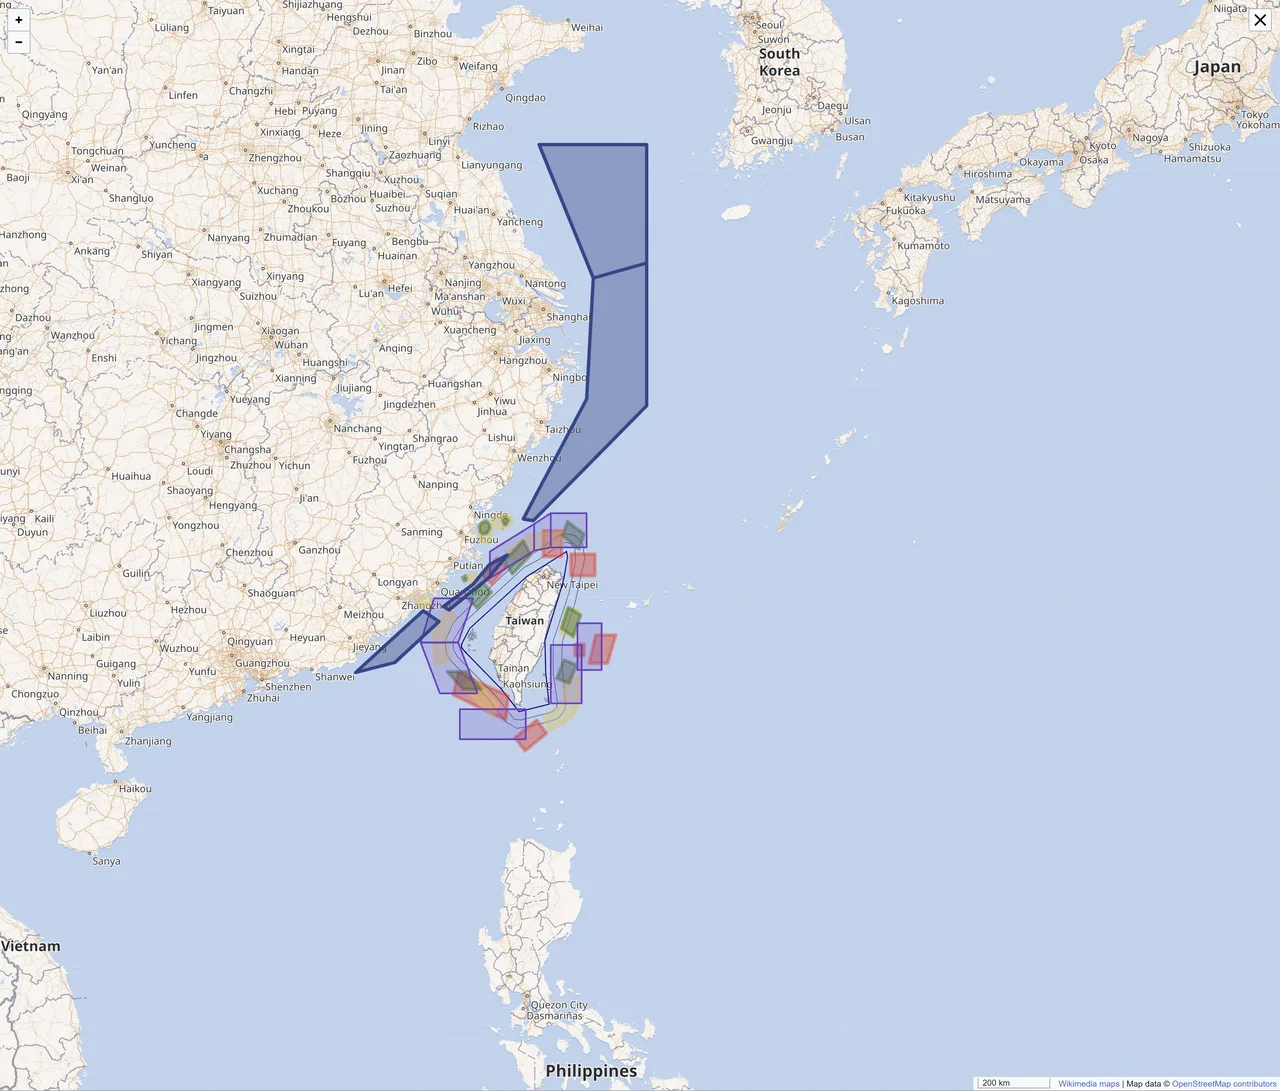
Chinese military exercises around Taiwan. The frequency of PLA incursions into Taiwan’s ADIZ has grown from under 10/month to over 200/month in 5 years. (Source: Wikimedia Commons, CC0)
What happens if China invades or blockades Taiwan? The AEI’s assessment: “a depression-level event.” Not recession — depression. Because:
- TSMC’s fabs cannot be instantly relocated — they represent decades of accumulated process knowledge
- There is no substitute — Intel’s U.S. fabs are multiple generations behind
- A rebuild of equivalent advanced chip capacity would take 5–10 years minimum
- Every AI system, every data center, every smartphone, every EV, every defense system depends on these chips
And here’s the memory chip intersection that makes this even more alarming: SK Hynix (South Korea) produces the majority of the world’s HBM — the memory used in AI accelerators. South Korea is also in China’s military theater. A Taiwan disruption + South Korea instability = simultaneous collapse of both memory and logic chip supply chains.
Taiwan’s “silicon shield” — the theory that its chipmaking indispensability protects it — is showing cracks. TSMC’s $100B U.S. expansion is deliberately designed to reduce this dependency, but it won’t create meaningful domestic capacity until roughly 2030.
The vulnerability window is now.
What I think: This is the black swan scenario — low probability, catastrophic impact. But “low probability” doesn’t mean zero. China’s military incursions are escalating geometrically. And as Dalio notes, wars often happen not because anyone planned them, but because a series of miscalculations made backing down impossible for both sides.
Source: CNBC — US-Taiwan silicon shield deal (Jan 2026) | MIT Technology Review — Silicon shield weakening | AEI — How Disruptive Would a Chinese Invasion Be? | CFR — Will China’s Reliance on Chips Prevent War?
7. The World Order: Not a Metaphor Anymore
I saved this for last because it’s the frame that holds everything together.
At the Munich Security Conference, February 13–15, 2026, the leaders of the Western world gathered and said, with varying degrees of alarm, the same thing:
German Chancellor Friedrich Merz: “The world order as it has stood for decades no longer exists.”
French President Emmanuel Macron: Europe must prepare for war. The old security structures are gone.
U.S. Secretary of State Marco Rubio: We are in a “new geopolitics era” because the “old world is gone.”
This is not fringe commentary. This is the heads of state of NATO’s core nations — at the premier global security conference — saying the post-1945 order is over.
And the world is already rearranging:
- Canada-China trade deal (January 2026): Canadian PM Mark Carney met Xi Jinping and reached a “preliminary but landmark” strategic partnership — a direct break from alignment with Trump’s trade agenda
- Britain-China partnership (February 2026)
- Germany-China strategic partnership (February 2026)
- EU “do no harm” posture with China: Euronews reports EU-China relations entering a phase of cautious engagement driven by fear of U.S. unpredictability
- Dollar hegemony erosion: The dollar’s share of official global reserves has dropped from 71% (1999) to 58% (2022) — a sustained structural decline. By May 2025, the U.S. registered the highest default risk among G7 countries — a complete reversal from 2021, when it registered the lowest.
Ray Dalio’s analysis of the Big Cycle — the historical pattern of great power transition — maps directly onto what’s happening. The declining power (U.S.) resists the erosion of its dominance. The rising power (China) pushes to reshape the rules. Before an all-out war: a decade of economic, technology, geopolitical, and capital wars. If we count from 2018, that decade ends in 2028.
What I think: The alignment shift is real and it’s being driven primarily by U.S. policy uncertainty under “America First” — not China’s charm offensive. When your closest allies are hedging toward your primary adversary, it’s not propaganda. It’s a rational response to perceived instability. The post-WWII order was sustained by American leadership, American markets, and American guarantees. All three are now conditional.
Source: The Nation — Munich Security Conference marks end of US-led order | CNN — US allies pivot to China (Feb 2, 2026) | Bloomberg — Canada-China trade deal (Jan 2026) | CNBC — Too many roads lead away from Trump (Feb 2026)
The Compound Effect: Why This Moment Is Different
None of these crises is unprecedented in isolation. What’s unprecedented is their simultaneity and their interdependence.
Here’s how they amplify each other:
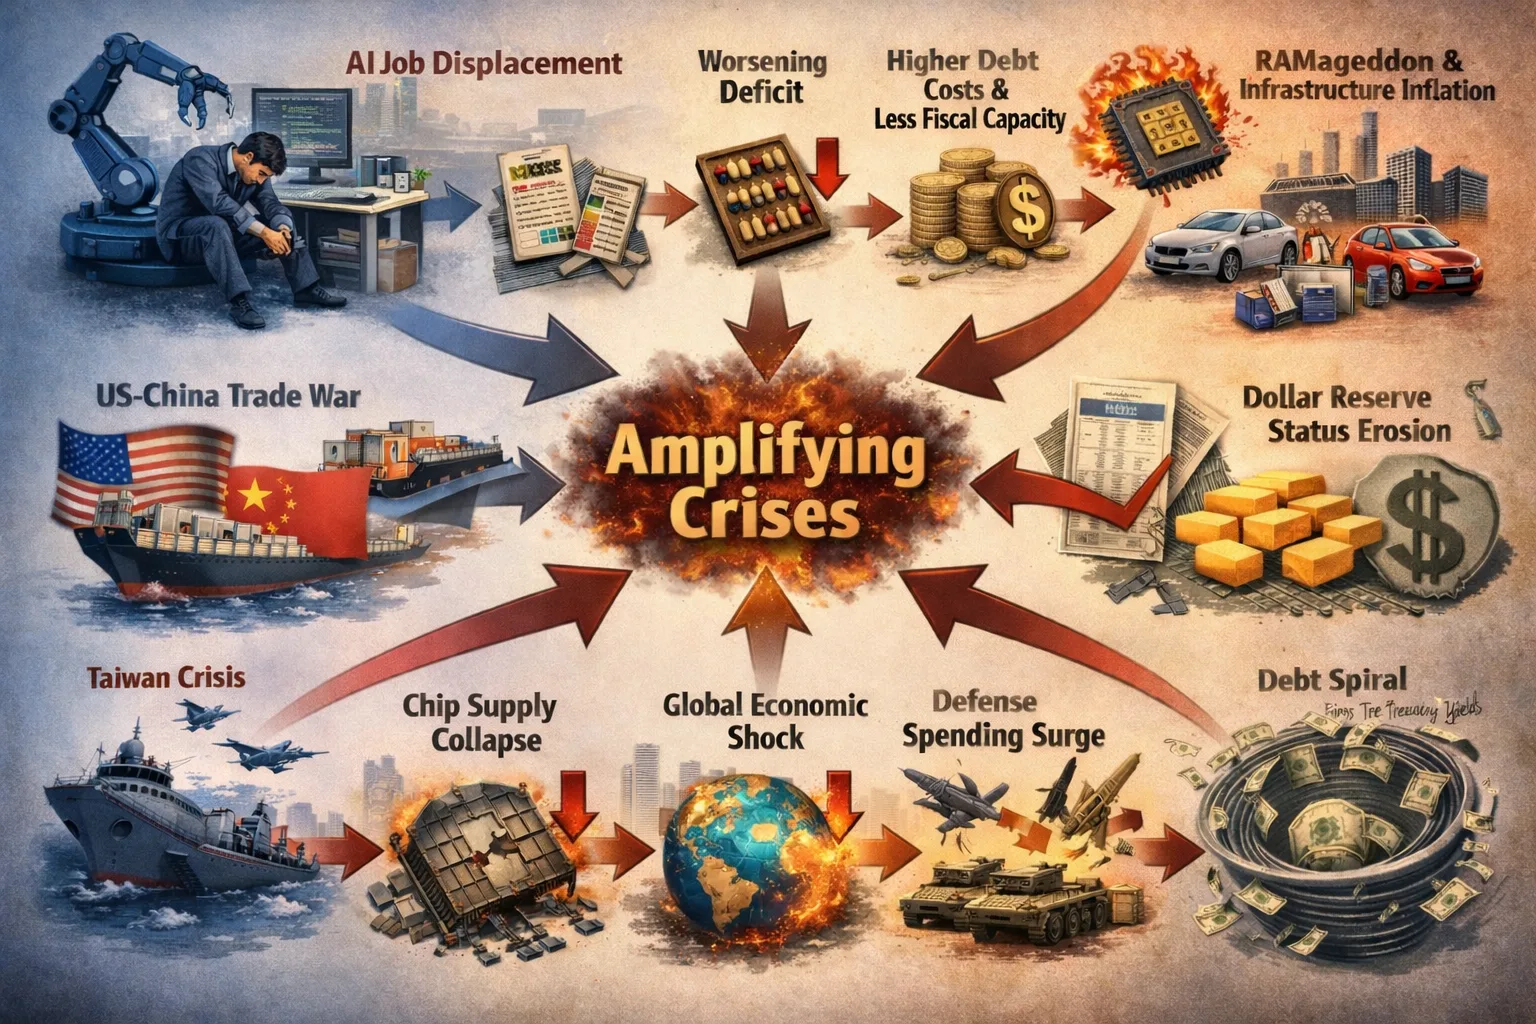
The diagram sketches conditional transmission pathways, not verified effects of equal strength. Employment losses could reduce some tax receipts; productivity and profits could increase others. A Taiwan disruption could affect chip supply and defense spending, but its scale and policy response are uncertain. Reserve-currency shifts do not mechanically determine Treasury yields. These links require evidence and explicit assumptions before they can be combined into a forecast.
Each crisis feeds the others. This is the “doom stack” — not a collection of separate problems, but a web of reinforcing dynamics.
Is This Like 2008? Is It Like the Great Depression?
The 2008 Financial Crisis:
| Factor | 2008 | Today |
|---|---|---|
| Primary cause | Housing bubble, derivatives | Multiple simultaneous structural shifts |
| Speed of onset | Sudden (Lehman weekend) | Gradual structural split (K-shaped divergence) |
| Sector affected | Finance, housing | Technology, labor, geopolitics, fiscal |
| Policy response available | Fed could print money, bailouts | Fed constrained by inflation; fiscal constrained by debt |
| Number of simultaneous disruptions | 2–3 | 7+ |
The Economic Survey 2025-26 warned that a systemic shock triggered by an AI investment bust could be “far greater in intensity and magnitude than the 2008 global financial crisis.”
The key difference: 2008 was a financial plumbing problem. You could fix it by unclogging the pipes — guaranteeing deposits, supporting banks, quantitative easing. The policy response was decisive and worked.
What we face today is structural, not cyclical. AI displaces labor structurally. Debt compounds mathematically. Geopolitical fracturing doesn’t reverse overnight. These are not crises that can be resolved with a weekend emergency meeting at the Fed.
The Great Depression:
The Great Depression of 1929–1939 was caused by a convergence of:
- Debt deflation after a speculative bubble
- Bank failures eliminating money supply
- Tariff wars reducing global trade (Smoot-Hawley)
- Drought and agricultural collapse
- Wealth inequality at historic extremes
Today’s convergence has some parallels:
- Debt overhang at record peacetime levels
- Potential technology-driven deflation of labor (wages)
- Trade war escalation (tariffs, export controls)
- Wealth inequality at historic extremes (AI amplifies returns to capital)
The key difference from the Depression: Today we have institutional safety nets (FDIC, Social Security, unemployment insurance) that didn’t exist in 1929. These don’t prevent disruption, but they cushion the fall.
The key similarity: In both the Depression and the 1930s European political crisis, the underlying pressures had been building for years before the collapse moment. Nobody thought 1928 was a doom year. The market was at all-time highs.
The IMF has explicitly compared the AI investment boom to the dot-com bubble — but said a systemic crisis is unlikely. The IMF’s chief economist’s position: AI investment has increased by less than 0.4% of U.S. GDP since 2022 (vs. 1.2% for dot-com between 1995–2000). The bubble, if it is one, is smaller than many assume.
What Could Actually Counter the Doom Scenarios
Before you close this article convinced the world is ending, I want to be honest about the countervailing forces. These are real, not wishful thinking. The outcome is not predetermined.
Counter 1: The Fab Building Boom Will Ease RAMageddon — Eventually
RAMageddon is real today, but it has a natural ceiling: the industry is spending at historic scale to build its way out.
The numbers being committed are staggering:
| Company | Investment | What’s Being Built |
|---|---|---|
| TSMC | $100B+ in the U.S. alone | Up to 12 fabs in Arizona; 9 new global facilities in 2025 alone |
| SK Hynix | $106B fab complex | M15X fab online end-2025; new P&T7 HBM packaging plant starting April 2026; $3.9B U.S. facility in Indiana |
| Micron | CHIPS Act funded | U.S. HBM and DRAM capacity expansion |
| Samsung | Ongoing multibillion expansion | HBM3E and beyond |
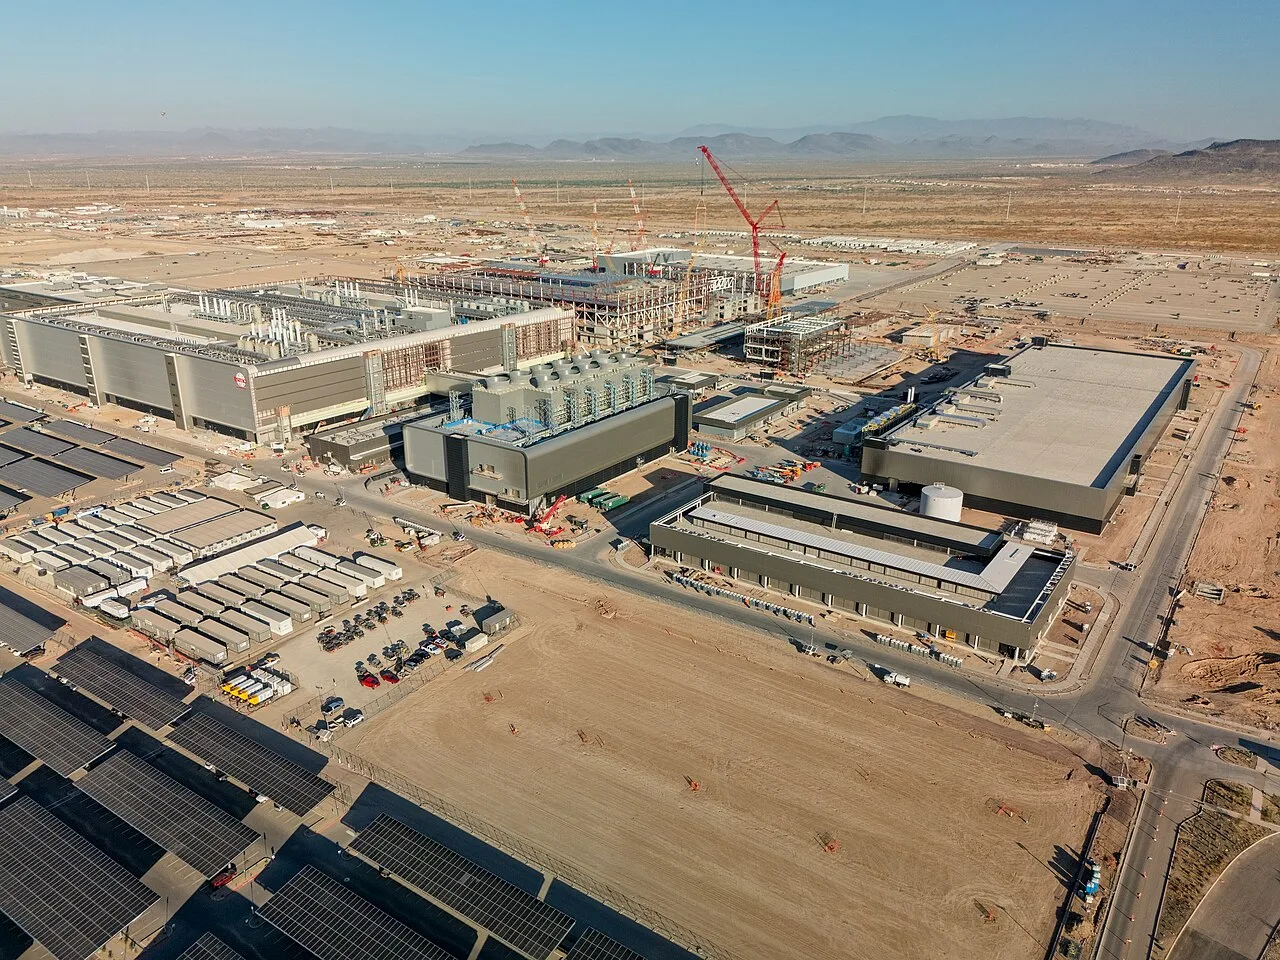
TSMC Fab 21 construction in Chandler, Arizona. TSMC is investing $100B+ in U.S. manufacturing — the largest foreign semiconductor investment in American history. (Photo: TrickHunter, CC BY-SA 4.0)
TSMC’s capex alone is projected at $40–46B annually through 2026–2028. SK Hynix accelerated its M15X expansion — equipment move-in kicked off ahead of schedule. TSMC is reportedly planning up to 12 Arizona fabs.
The catch: Fab construction lead times are 2–3 years minimum. The capacity being committed today comes online in 2027–2028. The shortage is real now and will remain real through 2026. But this is not a permanent constraint — it is a supply lag being aggressively closed with the largest semiconductor capex in history.
The second catch: More fabs also means the Taiwan single-point-of-failure is slowly being diversified. U.S. domestic advanced chip capacity, while still far behind TSMC Taiwan, is being built in a way it never was before. The silicon shield is moving — slowly — onto safer geographic ground.
Counter 2: AI Productivity Could Fix the Debt — If It Arrives Fast Enough
The “golden age” scenario isn’t fantasy. If AI-driven productivity growth sustainably lifts nominal GDP by even 1–2 additional percentage points per year, it materially changes the debt math.
Higher growth can improve the debt trajectory, but it does not guarantee stabilization. The primary balance and effective interest rate still matter, as the illustrative calculation above shows. A projected increase in the level of GDP by a future date is also different from an additional annual growth rate.
Wharton’s Penn Budget Model projects AI adding 1.5% to GDP by 2035, nearly 3% by 2055. Goldman Sachs has modeled even higher scenarios. These are not certainties, but they are plausible enough that “debt spiral” is not inevitable — it’s conditional.
The signals to watch are measured productivity, employment, taxable incomes and profits, the primary balance, and effective debt service. The distribution of gains affects revenue, but gains accruing to capital do not imply zero tax receipts.
Counter 3: Demand Elasticity — The Economics of Abundance
The most persistent optimistic counterargument deserves serious weight: when the cost of cognitive work drops dramatically, demand for it may surge enough to offset job losses.
The 19th century textile example is real. When automation reduced the cost of cloth by 98%, demand for cloth increased so much that total weaving employment rose for decades before eventually declining. If AI reduces the cost of legal services by 80%, demand for legal work — from people and businesses who currently can’t afford it — may increase dramatically.
The same logic applies to medical diagnosis, financial planning, software, education, creative work. These are markets where demand has been artificially suppressed by cost. Price compression could unlock massive latent demand.
The uncertainty: This effect works over long time horizons. It does not help the paralegal whose job disappears this year. And it requires that the productivity gains be passed to consumers (as lower prices) rather than captured entirely as corporate margin — which the K-shape data suggests is the more likely near-term outcome.
What to Watch — The Signals That Tell You Which Way It’s Going
| Signal | Doom confirms | Counter-narrative confirms |
|---|---|---|
| HBM memory prices | Still rising sharply | Plateauing or falling as new capacity online |
| Entry-level employment in AI-exposed roles | Declining faster, spreading across sectors | Stabilizing; new AI-adjacent roles offsetting losses |
| Primary deficit (% of GDP) | Worsening | Improving — AI revenue growth showing up in tax receipts |
| r-g differential | Positive (r > g, debt compounding) | Turning negative (growth outpacing rates) |
| TSMC/SK Hynix U.S. capacity | Delayed, behind schedule | On schedule, ahead of schedule |
| China Taiwan military incursions | Escalating frequency | Stabilizing or diplomatic engagement resuming |
| Dollar reserve share | Accelerating decline below 55% | Holding above 57–58%, slow erosion |
| K-shape divergence | Labor share of GDP keeps falling | Labor share stabilizes as productivity gains diffuse |
The doom narrative is not wrong. But it is not inevitable either. The disruptions are real. The timelines are uncertain. The countervailing forces are also real and also underreported.
The worst response is either to ignore all of this or to panic about all of it. The right response is eyes open, planning ahead, and tracking the signals that tell you which scenario is actually unfolding.
Source: Tom’s Hardware — SK Hynix U.S. HBM packaging plant ($3.9B) | Data Center Dynamics — TSMC $100B + SK Hynix $106B complex | Digitimes — TSMC 12 Arizona fabs (Jan 2026) | Digitimes — SK Hynix M15X accelerated (Dec 2025) | AnySilicon — TSMC 9 new fabs in 2025